Info 1: Trading time frame definition
Info 2: Trading time frameworks
Info 3: Trading time frame vs traded history
Info 4: Example for trading time frame
Quick pick
Setting that is used for visible the price movement of the chart in one public Securities is what is known as a trading time frame.
Opening information:
Trading time frame breaks into three words trading, time, and frame. Trading is activities of buying and selling, time means the process of one point to another, and frame means setting.
Trading time frame means setting that you used to point to point from buy and sell. This article contains information about the what is the trading time frame, how the trading time frameworks, and what is the difference between the trading time frame and traded history, finally one brief example of the trading time frame.
Info 1: Trading time frame definition
Mr.Neil is a stock trader who has a million-dollar portfolio with more than 18 years of experience speculating any kind of public securities.
He held about three kinds of securities over the past 3 years which means 20 percent of his portfolio held on forex Currencies in the day trading chart, then 65 percent of the remaining portfolio holds about equities stocks on the weekly trading chart.
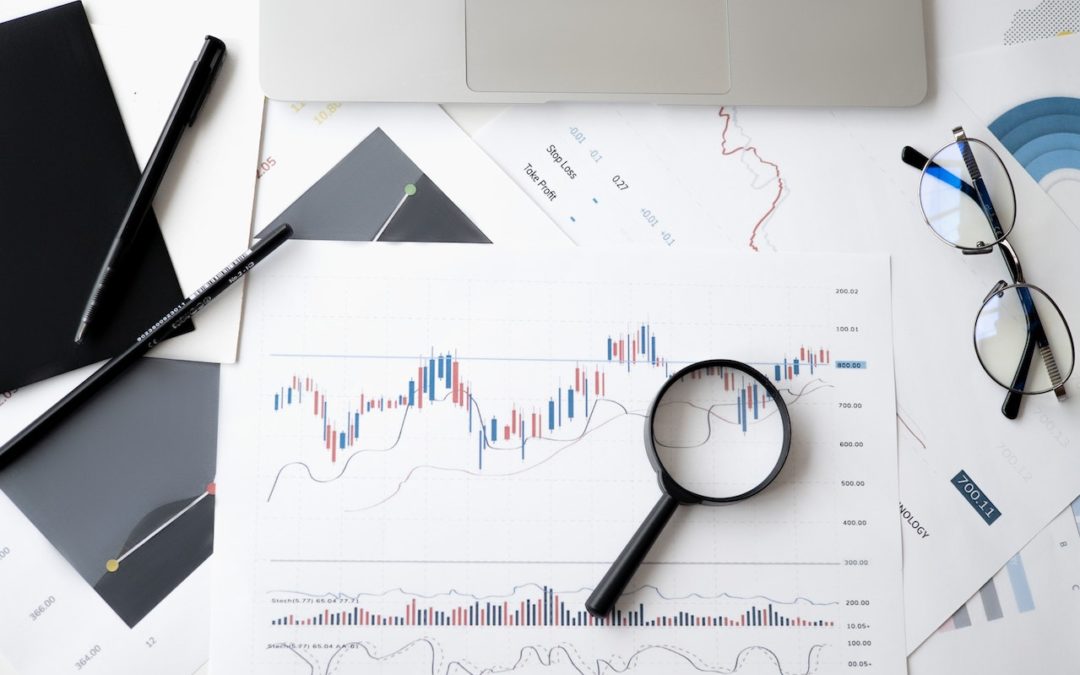
The remaining 15 percent of the portfolio is held on commodities which is held on the monthly trading chart. Here the day trading chart, weekly trading chart, and monthly trading chart of price that are shown for the investors and traders are known as the trading time frame of each price movement.
The price chart of moving one security from one point to another point with distinct minutes, hours, days, weeks, and months are called the trading time frames for public Securities.
This concept of trading is involved in the whole public market for all kinds of investors to traders for trading the securities based on their needs and end goals in investment and trading. So let’s dive into separately each security trading time frame on different markets.
Info 2: Trading time frameworks
The trading time frame doesn’t represent any of the specific things or objects instead they are a concept that shows the traded price of one security in different periods.
However this time frame takes place in any kind of priced securities, its price movement is demonstrated in the manner in which period certain users view it.
Supposedly if the frame is not used to view the different periods of price movement they are not considered a trading time frame, because the frame that’s posses the function of showing the difference time of the chart in a candlestick bar chart or line chart.
If the forex trader trades the Currency market daily with a chart frame of each candlestick created on each day he has been trading on the day trading time frame chart.
Next, if the same forex trader would use the time frame with a candlestick chart that takes place each move within 4 hours it’s elaborated as a 4-hour trading time frame.
On the other hand, if any of the traders made an Investment in the equities stock with the use of 1-month candlestick charts, it means such traders use the one-month trading time frame chart.
In public Securities no time frame for price movement would be created for all the periods indeed it’s available in 1 minute, 5 minutes, 15 minutes, 30 minutes, 1 hour, 4 hours, 1 day, 1 week, and 1 month.
During any period each of the trader would have a chance to take place their trade in the public market securities.
Using all the time frames of one or more frames traders would able to view different types of price movement at each different price period.
Trading time frame and trading history are confused by most people, so let’s jump into the key difference in it anyway.
Info 3: Trading time frame vs traded history
Trading time frame is a tool that helps to view the history of past price movement from the initial point to the endpoint.
On the other side, traded history is not a price, in spite it’s the behavior of how the Investment and investors influenced such trading securities.
So the trading history is used above the tool of trading time frame, to make more sense of the trading time frame let’s look into one brief example below.
Info 4: Example for trading time frame
Say you and your nephew are forex traders and had the experience for more than 10 years. Imagine that You trade using the 15 minutes price trading charts.
Then your nephew won’t trade under the 15 minutes price trading charts despite trading with the weekly price trading chart for the reason long long-term position. Here your trading price charts of 15 minimum and weekly are the frame of the trading time.

